


© 2025 DiscoverTheState.com. All rights reserved. Powered by DiscoverTheState.com

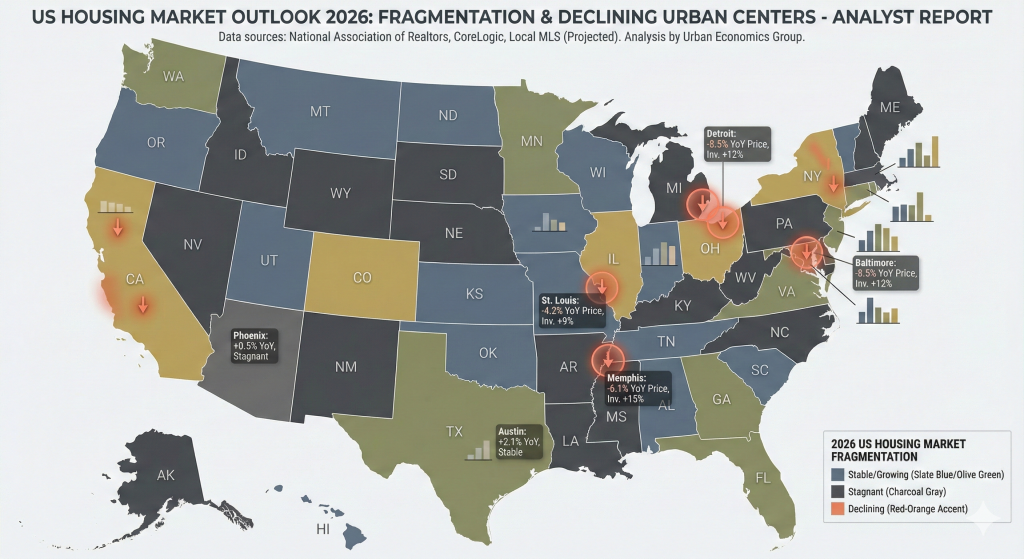
Why the 2026 housing market matters
The 2026 housing collapse cities narrative is not about a nationwide crash. Instead, it reflects a fragmented market where local fundamentals finally matter again. National averages still suggest stability. However, Zillow data shows a different story beneath the surface.
In many cities, affordability ceilings, elevated mortgage rates, and rising ownership costs are colliding with prices set during the boom years. As a result, some markets are quietly moving backward. This is not panic selling. It is recalibration.
Understanding which cities are under pressure helps buyers avoid overpaying, sellers price realistically, and investors manage risk with clearer expectations.
Key warning signals behind the 2026 housing collapse cities
Several shared signals explain why these markets are struggling:
-
Affordability ceilings: Prices rose faster than incomes during the surge years.
-
Higher monthly payments: Mortgage rates remain elevated, restoring payment discipline.
-
Rising ownership costs: Insurance, taxes, and maintenance now weigh heavily on demand.
-
Buyer psychology shift: Fear of missing out has been replaced by caution and negotiation.
Zillow’s Home Value Index confirms that even small demand shifts now produce outsized effects at the city level. You can explore broader pricing trends directly via the Zillow Home Value Index.
2026 housing collapse cities: countdown and breakdown
10. Houma, Louisiana
Houma illustrates an early-stage unwind. Prices rose during the boom without a matching change in local income or population growth. In 2026, homes are sitting longer, and sellers are cutting prices to meet a smaller buyer pool. Demand exists, but it is thinner and more cautious.
9. Lake Charles, Louisiana
Lake Charles did not experience investor frenzy. Still, prices drifted above what local wages support. Zillow data shows repeated price adjustments and longer days on market. Without strong economic diversification, buyers are unwilling to stretch.
8. Lafayette, Louisiana
Lafayette’s correction is quiet but persistent. Affordability once anchored the market. That anchor loosened during the surge. Now, buyers focus on monthly costs, while sellers gradually concede ground.
7. New Orleans, Louisiana
New Orleans faces pressure from rising insurance, taxes, and maintenance costs. Cultural appeal remains strong. However, buyers increasingly compare total ownership costs with newer, cheaper alternatives. As a result, demand has softened.
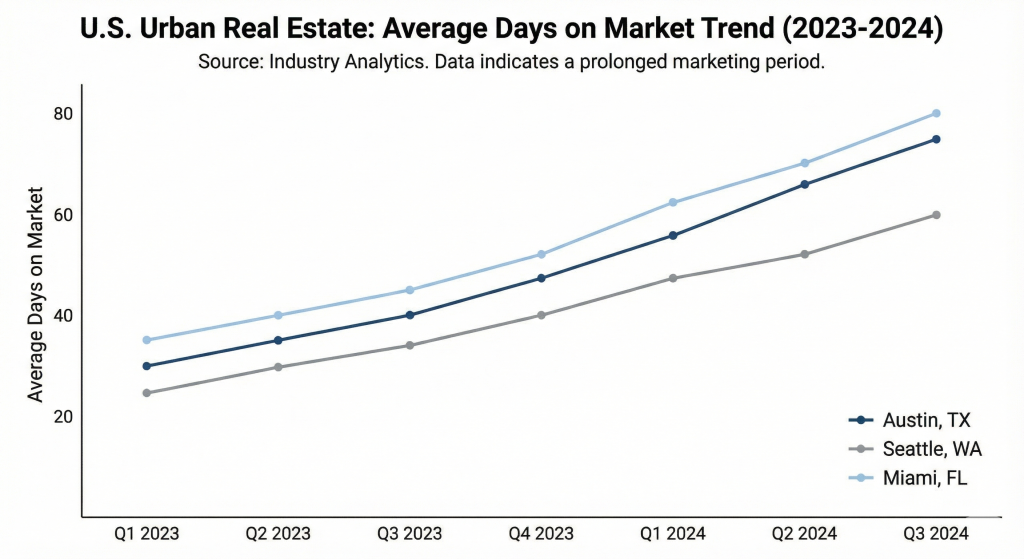
6. Austin, Texas
Austin’s boom was fueled by remote work and cheap financing. In 2026, those forces have faded. Inventory has increased in certain segments, and buyers are no longer stretching. Price momentum has clearly reversed.
5. Dallas–Fort Worth, Texas
Dallas–Fort Worth remains economically diverse. However, rapid suburban construction during the surge created more supply than current demand absorbs. Builders are offering incentives, and sellers face longer timelines.
4. San Antonio, Texas
San Antonio benefited from spillover demand from Austin. That affordability advantage has narrowed. Zillow data shows longer listing times and more frequent price cuts as buyers reassess value.
For related regional context, see our breakdown of Texas risk trends in
Texas housing markets showing early stress.
3. Tampa, Florida
Tampa surged on migration and lifestyle appeal. In 2026, insurance costs and property taxes are reshaping affordability. Inventory has improved, and buyers are negotiating aggressively.
2. Miami, Florida
Miami remains desirable, but affordability ceilings are firm. Domestic buyers are pulling back as insurance and taxes rise. Cash and international buyers remain, yet demand is narrower.
We previously saw similar dynamics emerge in
Florida cities where housing demand is cooling.
1. Orlando, Florida
Orlando tops the list of 2026 housing collapse cities. Investor-driven demand inflated prices quickly. As financing tightened, buyer caution increased. Zillow data shows sustained price pressure, longer listing times, and growing seller flexibility.
What this means for buyers
For buyers, 2026 rewards patience. Negotiation power has returned in many of these markets. Focus on total ownership costs, not just list prices. Tracking local trends via the Redfin Data Center can help confirm whether price adjustments are accelerating.
What this means for sellers
For sellers, realism matters. Time on market now carries real financial cost. Pricing close to peak-era expectations often leads to longer listings and deeper cuts later. Adjusting early usually preserves more value.
What this means for investors
For investors, momentum-based strategies are fragile in 2026. Cash flow, income alignment, and long-term demand matter more than appreciation narratives. Markets with slowing population growth or rising ownership costs deserve extra caution.

Final takeaways on the 2026 housing collapse cities
The 2026 housing market is not moving together. It is fragmenting. Zillow data makes that clear. Cities that surged fastest without income support are now correcting first.
This article is for educational purposes only and not financial or legal advice.
For the full visual breakdown and deeper city-by-city context, watch the full video on our Discover the State YouTube channel.
FAQ: 2026 housing collapse cities
Is there a nationwide housing crash in 2026?
No. The 2026 housing collapse cities reflect localized recalibration, not a national crash.
Why are some cities falling faster than others in 2026?
Because affordability limits, ownership costs, and local demand vary widely by city.
Is it a good time to buy in 2026 housing collapse cities?
For disciplined buyers, yes. Negotiation power has improved, especially where prices outran incomes.
What data should I watch in 2026?
Days on market, price reductions, inventory trends, and local income alignment. Zillow and Redfin are strong starting points.
Are these cities risky for investors in 2026?
They can be. Investors should prioritize cash flow and long-term demand over short-term appreciation stories.
No Comments