


© 2025 DiscoverTheState.com. All rights reserved. Powered by DiscoverTheState.com

Intro: Why this market shift matters
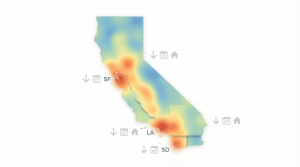
The California housing crash 2025 isn’t happening everywhere at once. However, in specific cities, you can see the break clearly in listing behavior: longer days on market, repeated price cuts, and sellers quietly stepping off peak expectations.
This isn’t a doom story. It’s a repricing story. The same homes are still there, but the monthly payment crossed a line for normal buyers.
What changed in 2025: same house, different monthly
California didn’t “break” because people stopped wanting California. It broke in pockets because the payment stack got too heavy.
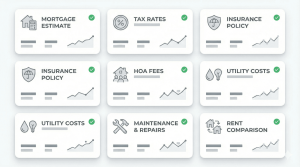
In addition to price, buyers now feel the full carrying-cost bundle:
-
Mortgage rates staying higher than many expected (track the rate environment on FRED: https://fred.stlouisfed.org/series/MORTGAGE30)
-
Taxes that reflect prior peak valuations
-
Insurance pressure and rising condo/master-policy costs
-
HOA dues that keep moving up, not down
-
Utility costs that punish bigger homes and long commutes
As a result, the market’s language changed. Buyers stopped racing. Sellers started negotiating. Builders started paying for attention.
Key warning signals to watch (before the headlines)
If you want to spot a “prices just broke” moment early, watch behavior first, not vibes.
These are the repeatable warning signals:
-
Days on market rising: 21 → 30 → 45 → 90+ starts feeling normal
-
Price cuts stacking: second and third reductions on the same address
-
Back-on-market listings: appraisal, inspection, or financing failures
-
Concessions spreading: rate buydowns, closing credits, repair money
-
Inventory building: more listings staying active month to month
You can ground-check these signals quickly using:
-
Redfin Data Center (https://www.redfin.com/news/data-center/)
-
Zillow Research & data (https://www.zillow.com/research/data/)
-
FHFA House Price Index for macro context (https://www.fhfa.gov/DataTools/Downloads/Pages/House-Price-Index.aspx)
California housing crash 2025: the 9-city countdown
This list isn’t “best vs worst.” It’s where affordability strain and seller behavior are admitting the truth fastest.
#9 – Bakersfield: “more house for the money” hits a wall
Bakersfield worked when the commute-and-value tradeoff felt worth it. In 2025, higher payments plus rising carrying costs are forcing buyers to pause.
What you’ll notice: mid-tier listings linger longer, and sellers anchored to 2022 pricing start trimming sooner.
#8 – Fresno: affordability magnet, but budgets have limits
Fresno benefited from spillover demand and the “still cheaper than coastal” narrative. However, when the monthly rises, essential-worker buyer pools thin out fast.
The pressure shows up as stale listings around key payment thresholds, not necessarily dramatic headline drops.
#7 – Riverside: the commute tradeoff stops feeling smart
Riverside’s identity has long been “SoCal access without SoCal pricing.” In 2025, rates and commuting costs turn that trade into friction.
You’ll often see more time on market for move-up homes and more buyer pushback on inspection and credits.
#6 – Sacramento: remote-work spillover cools
Sacramento absorbed Bay Area money during the boom. Now remote-work certainty is less universal, and buyers are more selective.
As a result, homes priced like the migration wave never ended are the ones taking reductions first.

#5 – San Diego: lifestyle still sells, but the ledger is louder
San Diego remains desirable. However, the payment stack makes even high earners hesitate.
Where it breaks first: price resistance in certain bands, more concessions, and buyers taking longer to commit.
#4 – Stockton–Lodi: spillover value story weakens
Stockton–Lodi sold as “Bay Area adjacent but cheaper.” When “cheaper” stops feeling cheap, demand becomes thinner.
Expect longer listing cycles and more negotiation leverage for buyers, especially when investors step back.
#3 – Irvine: status is strong, but all-in costs are heavy
Irvine’s brand is elite schools and clean master planning. Yet the all-in monthly (price + HOA + taxes) pushes many households into “not worth it” territory.
This is where you see a market split: some buyers still stretch, while others cross-shop aggressively or rent longer.
#2 – Oakland: complexity + higher borrowing costs = selectivity
Oakland is still Oakland—culture, location, and real demand. But buyers now underwrite risk and payment more strictly.
Well-positioned homes can still move. Marginal listings sit, cut, and re-cut.
#1 – San Jose: even tech’s front yard shows price resistance
San Jose is the ultimate “can’t lose” narrative. In 2025, even here, buyers are pushing back harder, especially when income confidence feels less guaranteed than peak-boom years.
The takeaway isn’t that San Jose is “done.” It’s that the tolerance for mispricing is lower—even in elite markets.
What this means for buyers
Your advantage in this cycle is not speed. It’s structure.
Operate like a calm underwriter:
-
Build a watchlist of homes sitting 21, 30, 45+ days
-
Treat list price as a starting point, not a command
-
Keep inspection and financing contingencies
-
Ask for concessions early: rate buydown, closing credits, repair credits
-
Run a five-year monthly: mortgage + taxes + insurance + HOA + utilities + repairs vs realistic rent
If the deal only works with financial gymnastics, it doesn’t work yet.
What this means for sellers
The market will forgive realism. It will punish denial.
Sellers who win in 2025 usually do three things:
-
Price to today’s pendings and closes, not peak comps
-
Remove uncertainty with a pre-inspection and clear disclosures
-
Lead with a real incentive package (rate buydown + closing costs) instead of slow public price cuts
Decide your lane early: must-move, trade-up, or hold-and-rent. Each strategy has a different pricing and risk tolerance.
What this means for investors
This phase is a stress test. Appreciation fantasies get exposed quickly.
A disciplined investor playbook in 2025:
-
Underwrite with conservative rents and higher expense assumptions
-
Treat insurance, HOA, and maintenance as rising, not temporary
-
Model a flat-price scenario for 3–5 years
-
Buy only if the property pays you to hold it, not if it “might go up”
Also, don’t ignore physical risk. Check FEMA flood exposure when relevant (https://msc.fema.gov/portal/home) and price that risk into your long-term plan.

Final takeaways: California isn’t collapsing, it’s being repriced
California still has real demand drivers. However, the pricing story that worked in 2021–2022 doesn’t automatically clear in 2025.
If you want the cleaner pattern behind this shift, compare it with nearby repricing maps like Nevada’s correction zones (https://discoverthestate.com/nevada-housing-market-faces-major-correction-heres-where-it-hits-hardest/) and Arizona demand cracks (https://discoverthestate.com/top-10-cities-in-arizona-where-buyer-demand-has-collapsed-in-2025/). In addition, many of these “quiet first” signals are showing up nationally in suburb behavior (https://discoverthestate.com/u-s-suburbs-turning-into-housing-ghost-towns-in-2025/).
For a broader California scan beyond this nine-city list, also see our statewide breakdown here: https://discoverthestate.com/california-cities-home-prices-fall-in-2025-top-10-cities-facing-rapid-declines/
This is educational content, not financial, tax, or legal advice. Always do your own research and consult licensed professionals.
Watch the full video breakdown on our Discover the State YouTube channel.
FAQ
Is the California housing crash 2025 real, or just normal cooling?
It’s real in specific pockets where price cuts, longer days on market, and concessions are stacking. However, it’s not uniform statewide. Think “repricing zones,” not “statewide collapse.”
Which cities are seeing the biggest signs of the California housing crash 2025?
In this breakdown, the clearest “tape change” shows up across Bakersfield, Fresno, Riverside, Sacramento, San Diego, Stockton–Lodi, Irvine, Oakland, and San Jose—each for slightly different affordability reasons.
Is it a good time to buy in California in 2025?
It can be, if you’re payment-first. Focus on listings sitting 30–60+ days, keep contingencies, and negotiate for credits. If the monthly doesn’t work cleanly, waiting is a strategy—not a failure.
What should sellers do during the California housing crash 2025?
Price to current pendings and closes, not peak comps. Reduce uncertainty with pre-inspections and disclosures. Lead with incentives early to avoid the slow, public “cut-and-chase” cycle.
What data should I watch to track California’s market in 2025?
Track days on market, inventory, and price-cut share on Redfin Data Center and Zillow’s datasets. For macro context, watch mortgage rates on FRED and house price trends via FHFA.
No Comments