
Nevada Housing Meltdown 2025: 10 Desert Cities Drowning in Price Cuts
Intro: why this market matters right now
Nevada housing meltdown 2025 isn’t a headline you read—it’s behaviour you see. Open houses feel quieter. Listings you recognise keep reappearing. And “price improvement” is suddenly doing the work that bidding wars used to do.
Nevada matters because it’s a stress-test market. It runs on migration, investors, and payment sensitivity. When the monthly payment stops fitting real incomes, the shift shows up fast—and it spreads city to city.
Key warning signals in the Nevada housing meltdown 2025
This phase is not about drama. It’s about repeatable signals that keep stacking up.
Here’s what “meltdown” looks like in grown-up terms:
-
Days on market (DOM) stretches compared to last year.
-
Multiple price cuts hit the same address (cut, relist, cut again).
-
Inventory lingers because new listings arrive faster than buyers absorb them.
-
Seller concessions normalise (closing costs, rate buydowns, prepaid HOA).
-
Deals fail more often at inspection, appraisal, or financing—then come back “improved.”
If you want to sanity-check what you’re seeing, compare your local tape against:
-
Redfin Data Center: https://www.redfin.com/news/data-center/
-
Zillow Research (ZHVI and market trends): https://www.zillow.com/research/
-
Freddie Mac weekly mortgage rates (PMMS): https://www.freddiemac.com/pmms
-
Federal Reserve FRED 30-year fixed series: https://fred.stlouisfed.org/series/MORTGAGE30US
-
FHFA House Price Index: https://www.fhfa.gov/data/hpi
And yes—the core driver is still the same: the all-in monthly (mortgage + taxes + insurance + HOA + utilities + repairs). When that number outruns paychecks, the market stops negotiating “up” and starts negotiating “down.”

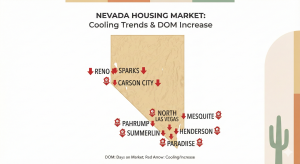
The 10-city breakdown: where price cuts are stacking first
We’re counting down from the “obvious cracks” to the “symbolic breaking points.”
10) Carson City
Carson City still feels stable. However, resales in 1990s and 2000s neighbourhoods are sitting longer, and that first price cut shows up sooner than it used to. The payment pressure hits retirees and mid-income households first, so sellers lose urgency before buyers do.
9) Mesquite
Mesquite was the quiet desert reward: golf, sun, and a slower pace. In 2025, fixed incomes collide with higher insurance, utilities, and HOA dues. As a result, listings linger unless they’re priced sharply or offered with real concessions.
8) Pahrump
Pahrump’s “cheap desert escape” story is ageing. Investor demand is thinner, and mid-tier homes that assumed endless buyer flow are taking cuts in clusters. In addition, buyers are more inspection-sensitive here, which increases relists and renegotiations.
7) North Las Vegas
North Las Vegas was the affordability gateway. Now the overhead stacks up—taxes, utilities, everyday costs—and wages didn’t rise at the same pace as the payment. Therefore, entry-level belts show longer DOM, more incentives, and softer negotiation outcomes.
6) Sparks
Sparks was supposed to be Reno’s clean spillover. Builders kept pushing phases assuming demand would keep pouring in. In 2025, you see the tell: closing-cost help, rate buydowns, and “last homes” banners that somehow stay up for weeks.
5) Henderson
Henderson still photographs like a safe bet. Meanwhile, the ledger is louder: HOA dues, insurance, utilities, and elevated prices push the monthly above what solid local incomes can comfortably carry. Homes still sell—but they negotiate their way there.
4) Reno
Reno is where the buyer mindset flips from “growth story” to “underwrite everything.” High-2021 purchases try to exit into a thinner pool, so reductions become the language that gets showings back. If you’re watching one metric, watch how often the same listing cuts twice.

3) Summerlin
Summerlin is the prestige signal. The brand says “bulletproof,” but the payment says “prove it.” In this tier, buyers don’t panic-buy. They negotiate terms, compare monthly costs across neighbourhoods, and walk if the numbers don’t clear their budget.
2) Las Vegas
This is the real valley market: the subdivisions where normal households live. When overtime fades or shifts get cut, the same mortgage, taxes, insurance, and HOA feel heavier. Therefore, inventory stacks, price cuts become routine, and investor appetite cools in the belts that used to be “easy doors.”
1) Paradise (and condo corridors near the Strip)
This is the symbolic wobble. Investor-heavy corridors depend on confidence and carry-cost tolerance. In 2025, carrying costs vote instead: higher rates, steeper HOAs, insurance, utilities, and softer bookings. As a result, units sit longer and concessions become part of the sales script.
What this means for buyers
Your edge is not speed. It’s structure.
Use this playbook:
-
Build a watchlist of homes sitting 21, 30, 45+ days, especially after a second cut.
-
Treat list price as an opening position, not a command.
-
Keep inspection and financing contingencies. Walking is a win in this phase.
-
Negotiate like it’s normal: closing costs, repairs, permanent rate buydowns.
-
Run a five-year monthly: mortgage + taxes + insurance + HOA + utilities + maintenance, versus realistic rent.
If owning only works after financial gymnastics, it doesn’t work yet.
Internal context you may also like:
-
Arizona demand collapse playbook: https://discoverthestate.com/top-10-cities-in-arizona-where-buyer-demand-has-collapsed-in-2025/
-
California price-break signals: https://discoverthestate.com/california-housing-crash-update-9-cities-where-prices-just-broke-in-2025/
What this means for sellers
The market isn’t your enemy. Denial is.
Operate like this:
-
Price to current pendings and recent closings, not 2021/2022 screenshots.
-
Do a pre-inspection and remove deal-killers early.
-
Lead with a real incentive package on day one (rate buydown, closing credits), instead of bleeding through micro-cuts.
-
Make the house “easy to say yes to” for a payment-sensitive buyer.
Related reads on seller psychology and price discovery:
-
Illinois seller panic signals: https://discoverthestate.com/illinois-housing-crash-deepens-8-cities-where-sellers-are-panicking/
-
Florida markets cracking first: https://discoverthestate.com/florida-housing-market-on-the-edge-these-10-cities-are-cracking-first/
What this means for investors
In Nevada 2025, appreciation is not Plan A. Cash flow survival is.
Investor rules that work in this regime:
-
Underwrite rents conservatively and assume slower leasing.
-
Treat insurance and HOA increases as “likely,” not “maybe.”
-
Hold real reserves for repairs and vacancy.
-
Ask one blunt question: Does this property pay me to hold it if prices nap for five years?
If the deal only works in a best-case scenario, it’s speculation.
For broader context on supply and demand shifts:
-
Inventory up, buyers gone (state-by-state lens): https://discoverthestate.com/top-10-states-where-housing-inventory-is-up-but-buyers-are-gone/
-
Texas overbuild dynamics: https://discoverthestate.com/texas-housing-crash-spreads-7-overbuilt-cities-no-one-wants-to-buy-in/
Final takeaways
Nevada isn’t “over.” It’s being repriced after an easy-money decade where many payments only worked because the story was strong.
Nevada housing meltdown 2025 is best understood as a behaviour shift: longer DOM, stacked reductions, and concessions replacing bidding wars. If you’re calm, you can use this phase. If you’re emotional, it will use you.
This is educational content, not financial, tax, or legal advice. Always do your own research and consult licensed professionals.
Watch the full video breakdown on our Discover the State YouTube channel.
FAQ
Is Nevada housing meltdown 2025 a crash or a slow repricing?
For most areas, it looks like slow repricing first: longer days on market, multiple price cuts, and incentives. A “crash” is usually later-stage forced selling.
What’s the clearest sign a Nevada city is drowning in price cuts?
Two signals together: (1) rising DOM across normal homes and (2) the same listings cutting price twice, then adding credits. That combination usually means demand is thin.
Is it a good time to buy in Nevada in 2025?
It can be, if the all-in monthly fits your budget without gymnastics. Focus on stale listings, keep contingencies, and negotiate terms aggressively.
How do I know if a Las Vegas condo is risky in 2025?
Start with HOA reserves, assessment history, insurance costs, and rental rules. Then compare the five-year all-in monthly against realistic rent and vacancy risk.
What data should I watch for the Nevada housing meltdown 2025?
Track DOM, active listings, price-cut share, and pending sales. Cross-check using Redfin Data Center and Zillow Research, and benchmark mortgage rates via Freddie Mac or FRED.


No Comments