


© 2025 DiscoverTheState.com. All rights reserved. Powered by DiscoverTheState.com

Intro: Why this market shift matters
You don’t need a headline to feel it. In 2025, suburban housing ghost towns 2025 is starting to look less like a meme and more like a pattern. On Saturdays, open houses feel quieter. Listings sit longer. And the same homes keep reappearing with “price improvement” tags.
However, this is not about panic. It’s about reading behavior before the headlines catch up, so you can make decisions with numbers instead of vibes.
Key warning signals and data context
First, rewind the boom years. Suburbia surged on cheap money, remote work, and “bigger house for the same payment” math. Then rates rose, taxes recalibrated, and carrying costs expanded. As a result, the same house now carries a very different monthly.
To stay grounded, keep a simple dashboard. Track inventory, days on market, price cuts, and mortgage rates using sources like Redfin’s data center, Zillow’s research data, Freddie Mac’s PMMS, and the St. Louis Fed’s mortgage-rate series. Redfin+1
Also, notice how this “quiet cooling” shows up across markets we’ve covered—especially where story-driven demand ran ahead of affordability. For examples, see our breakdowns on Florida cooling first, Texas demand dying, and Arizona demand collapsing.
Suburban housing ghost towns 2025: Checklist and the three tiers
This is the core idea: a “ghost town” is not boarded windows. It’s a slow hollowing-out that starts with the math and shows up in behavior.
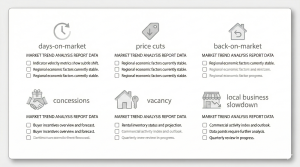
The Ghost-Town Checklist (apply this to your ZIP)
Use this as a fast diagnostic:
-
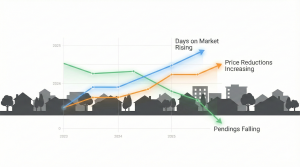
Days on market rising (21 → 30 → 45 → 90+ feels normal).
-
Repeated price cuts (2nd and 3rd cuts on the same address).
-
Back-on-market listings (inspection, appraisal, financing failures).
-
Builder concessions everywhere (rate buydowns, closing costs, “free upgrades”).
-
Vacancy signals (dark new builds, empty rentals, “for rent” sitting too long).
-
Local spillover (quieter schools, earlier restaurant closing times, weak foot traffic).
Tier 3 suburbs (the first to fade)
These are far-ring commuter belts and small-metro suburbs that boomed on “space + story.”
Meanwhile, commutes, gas, utilities, and insurance make big houses feel inefficient. Demand doesn’t vanish overnight—it pauses. Listings sit. Inventory quietly stacks.
If you want a similar “story breaks first” pattern, compare this to Nevada’s correction zones where incentives became the language of the market.
Tier 2 suburbs (name-brand schools, “bulletproof” reputations)
These were the dream belts: top school districts, medical hubs, lifestyle-adjacent suburbs.
However, the brand no longer overrides the monthly. HOA dues, childcare, utilities, and commute costs push total carrying costs into “not worth it” territory.
In addition, you’ll often see sellers offering rate buydowns up front—because they know buyers are payment-sensitive now.
Flagship suburbs (prestige areas that feel hollow, not abandoned)
These suburbs won’t look dead. They feel hollow.
You’ll still see nice cars. You’ll still see polished retail. Yet listings linger. New builds stay dark. Restaurants close earlier. Investors step back because rents don’t justify entry prices.
When flagship suburbs wobble, the whole metro’s confidence changes. You can see that “confidence snap” dynamic in Georgia’s sudden bidding-war die-off and in California’s repricing pockets.
What this means for buyers
Your edge is patience and leverage. Therefore:
-
Build a watchlist of homes sitting 21/30/45+ days, especially after a second cut.
-
Keep inspection and financing contingencies. Use the report as a negotiation script.
-
Ask for closing credits and permanent rate buydowns like they’re normal—because, in softer suburbs, they are.
-
Run a five-year monthly comparison: mortgage + taxes + insurance + HOA + utilities + repairs vs. realistic rent.
If the deal only works after financial gymnastics, it doesn’t work yet.
What this means for sellers
The market isn’t out to get you, but it punishes denial. So:
-
Price off current pendings and closings, not 2021–2022 memories.
-
Do a pre-inspection to remove surprise friction.
-
Lead with a real incentive package on day one (rate buydown, closing help, repair plan).
-
Avoid “death by tiny cuts.” Buyers watch that and assume you’re cornered.
What this means for investors
This phase is a cash-flow audit. In other words:
-
Assume conservative rent growth and sticky expenses.
-
Underwrite HOA and insurance as rising, not stable.
-
Require the property to pay you to hold even if prices go sideways for years.
-
If it only works in a best-case scenario, it’s speculation, not investing.

Final takeaways: suburbia isn’t dead, it’s being repriced
U.S. suburbia isn’t finished. It’s being repriced after an easy-money era where the story mattered more than the monthly. The “ghost town” risk shows up first in behavior: longer DOM, stacked price cuts, concessions, and quiet vacancies.
This is educational content, not financial, tax, or legal advice. Watch the full video breakdown on our Discover the State YouTube channel, and drop your ZIP, days on market, and price-cut patterns in the comments so we can map what’s happening in real time.
FAQ
1) Are suburban housing ghost towns 2025 real, or just normal cooling?
They’re real when the pattern repeats: DOM stretches, price cuts stack, and concessions become standard. Normal cooling doesn’t usually include persistent vacancies and repeated back-on-market listings.
2) What’s the clearest signal my suburb is drifting toward a housing ghost town in 2025?
A second or third price cut on multiple nearby listings, combined with 45–90+ days on market. That’s the market saying the payment no longer fits local demand.
3) Is it a good time to buy in suburban housing ghost towns 2025?
It can be—if you negotiate like a professional. Focus on long-sitting listings, keep contingencies, and demand credits/buydowns. The goal is a safe monthly, not a “win” on list price.
4) What should sellers do in suburban housing ghost towns 2025 to avoid getting stuck?
Price to today’s closings, do a pre-inspection, and offer a clear incentive package early. Waiting and cutting later often costs more and looks worse publicly.
5) What data should I watch weekly in 2025 suburbia?
Days on market, active inventory, percent of listings with price cuts, and mortgage-rate direction. Then compare those against rent levels and total ownership costs in your ZIP.
No Comments